Usage
valkey-benchmark [ OPTIONS ] [--] [ COMMAND ARGS... ]
Description
Simulates sending commands using multiple clients. The utility provides a
default set of tests. You can run a subset of the tests using the -t option or
supply one or more custom commands on the command line.
To supply multiple commands on the command line, separate them with ; as in
SET foo bar ';' GET foo. (Quote ';' to protect it from expansion by the shell.)
You can prefix a command in the sequence with a number N to repeat the command N times.
In command arguments, the following placeholders are substituted:
__rand_int__
: Replaced with a zero-padded random integer in the range selected using the -r option.
__data__
: Replaced with data of the size specified by the -d option.
{tag}
: Replaced with a tag that routes the command to the right cluster node.
Include this in key names when running in cluster mode.
Options
-h hostname
: Server hostname (default 127.0.0.1)
-p port
: Server port (default 6379)
-s socket
: Server socket (overrides host and port)
-a password
: Password for Valkey Auth
--user username
: Used to send ACL style 'AUTH username pass'. Needs -a.
-u uri
: Server URI on format valkey://user:password@host:port/dbnum.
User, password and dbnum are optional. For authentication
without a username, use username 'default'. For TLS, use
the scheme 'valkeys'.
-c clients
: Number of parallel connections (default 50).
Note: If --cluster is used then number of clients has to be
the same or higher than the number of nodes.
-n requests
: Total number of requests (default 100000)
-d size
: Data size of SET/GET value in bytes (default 3)
--dbnum db
: SELECT the specified db number (default 0)
-3
: Start session in RESP3 protocol mode.
--threads num
: Enable multi-thread mode.
--cluster
: Enable cluster mode.
If the command is supplied on the command line in cluster
mode, the key must contain "{tag}". Otherwise, the
command will not be sent to the right cluster node.
--rfr mode
: Enable read from replicas in cluster mode.
This command must be used with the --cluster option.
There are three modes for reading from replicas:
no - sends read requests to primaries only (default).
yes - sends read requests to replicas only.
all - sends read requests to all nodes.
Since write commands will be rejected by replicas, it is recommended to enable read from replicas only for read command tests.
--enable-tracking
: Send CLIENT TRACKING ON before starting benchmark.
-k boolean
: 1=keep alive 0=reconnect (default 1)
-r keyspacelen
: Use random keys for SET/GET/INCR, random values for SADD,
random members and scores for ZADD.
Using this option the benchmark will expand the string
__rand_int__ inside an argument with a 12 digits number in
the specified range from 0 to keyspacelen - 1. The
substitution changes every time a command is executed.
Default tests use this to hit random keys in the specified
range.
Note: If -r is omitted, all commands in a benchmark will
use the same key.
-P numreq
: Pipeline numreq requests. Default 1 (no pipeline).
-q
: Quiet. Just show query/sec values
--precision
: Number of decimal places to display in latency output (default 0)
--csv
: Output in CSV format
-l
: Loop. Run the tests forever
-t tests
: Only run the comma separated list of tests. The test
names are the same as the ones produced as output.
The -t option is ignored if a specific command is supplied
on the command line.
-I
: Idle mode. Just open N idle connections and wait.
-x
: Read last argument from STDIN.
--seed num
: Set the seed for random number generator. Default seed is based on time.
--rps requests
: Limit the total number of requests per second. Default 0 (no limit).
--tls
: Establish a secure TLS connection.
--sni host
: Server name indication for TLS.
--cacert file
: CA Certificate file to verify with.
--cacertdir dir
: Directory where trusted CA certificates are stored.
If neither cacert nor cacertdir are specified, the default
system-wide trusted root certs configuration will apply.
--insecure
: Allow insecure TLS connection by skipping cert validation.
--cert file
: Client certificate to authenticate with.
--key file
: Private key file to authenticate with.
--tls-ciphers list
: Sets the list of preferred ciphers (TLSv1.2 and below)
in order of preference from highest to lowest separated by colon (":").
See the ciphers(1ssl) manpage for more information about the syntax of this string.
--tls-ciphersuites list
: Sets the list of preferred ciphersuites (TLSv1.3)
in order of preference from highest to lowest separated by colon (":").
See the ciphers(1ssl) manpage for more information about the syntax of this string,
and specifically for TLSv1.3 ciphersuites.
--rdma
: Establish an RDMA connection.
--mptcp
: Establish an MPTCP connection.
--help
: Output help and exit.
--version
: Output version and exit.
Examples
Run the benchmark with the default configuration against 127.0.0.1:6379. You need to have a running Valkey instance before launching the benchmark:
$ valkey-benchmarkRun a benchmark with 20 parallel clients, pipelining 10 commands at a time, using 2 threads and less verbose output:
$ valkey-benchmark -c 20 -P 10 --threads 2 -qUse 20 parallel clients, for a total of 100k requests, against 192.168.1.1:
$ valkey-benchmark -h 192.168.1.1 -p 6379 -n 100000 -c 20Fill 127.0.0.1:6379 with about 1 million keys only using the SET test:
$ valkey-benchmark -t set -n 1000000 -r 100000000Benchmark 127.0.0.1:6379 for a few commands producing CSV output:
$ valkey-benchmark -t ping,set,get -n 100000 --csvBenchmark a specific command line:
$ valkey-benchmark -r 10000 -n 10000 eval 'return redis.call("ping")' 0Fill a list with 10000 random elements:
$ valkey-benchmark -r 10000 -n 10000 lpush mylist __rand_int__Benchmark a specific transaction:
$ valkey-benchmark -- multi ';' set key:__rand_int__ __data__ ';' \
                      incr counter ';' exec\n\n");
Running only a subset of the tests
You don't need to run all the default tests every time you execute valkey-benchmark.
For example, to select only a subset of tests, use the -t option
as in the following example:
$ valkey-benchmark -t set,lpush -n 100000 -q
SET: 74239.05 requests per second
LPUSH: 79239.30 requests per second
This example runs the tests for the SET and LPUSH commands and uses quiet mode (see the -q switch).
You can even benchmark a specific command:
$ valkey-benchmark -n 100000 -q script load "server.call('set','foo','bar')"
script load server.call('set','foo','bar'): 69881.20 requests per second
Selecting the size of the key space
By default, the benchmark runs against a single key. In Valkey the difference between such a synthetic benchmark and a real one is not huge since it is an in-memory system, however it is possible to stress cache misses and in general to simulate a more real-world work load by using a large key space.
This is obtained by using the -r switch. For instance if I want to run
one million SET operations, using a random key for every operation out of
100k possible keys, I'll use the following command line:
$ valkey-cli flushall
OK

$ valkey-benchmark -t set -r 100000 -n 1000000
====== SET ======
  1000000 requests completed in 13.86 seconds
  50 parallel clients
  3 bytes payload
  keep alive: 1

99.76% `<=` 1 milliseconds
99.98% `<=` 2 milliseconds
100.00% `<=` 3 milliseconds
100.00% `<=` 3 milliseconds
72144.87 requests per second

$ valkey-cli dbsize
(integer) 99993
Using pipelining
By default every client (the benchmark simulates 50 clients if not otherwise
specified with -c) sends the next command only when the reply of the previous
command is received, this means that the server will likely need a read call
in order to read each command from every client. Also RTT is paid as well.
Valkey supports pipelining, so it is possible to send multiple commands at once, a feature often exploited by real world applications. Valkey pipelining is able to dramatically improve the number of operations per second a server is able do deliver.
Consider this example of running the benchmark using a pipelining of 16 commands:
$ valkey-benchmark -n 1000000 -t set,get -P 16 -q
SET: 403063.28 requests per second
GET: 508388.41 requests per second
Using pipelining results in a significant increase in performance.
Notes
Pitfalls and misconceptions
The first point is obvious: the golden rule of a useful benchmark is to only compare apples and apples. You can compare different versions of Valkey on the same workload or the same version of Valkey, but with different options. If you plan to compare Valkey to something else, then it is important to evaluate the functional and technical differences, and take them in account.
- Valkey is a server: all commands involve network or IPC round trips. It is meaningless to compare it to embedded data stores, because the cost of most operations is primarily in network/protocol management.
- Valkey commands return an acknowledgment for all usual commands. Some other data stores do not. Comparing Valkey to stores involving one-way queries is only mildly useful.
- Naively iterating on synchronous Valkey commands does not benchmark Valkey itself, but rather measure your network (or IPC) latency and the client library intrinsic latency. To really test Valkey, you need multiple connections (like valkey-benchmark) and/or to use pipelining to aggregate several commands and/or multiple threads or processes.
- Valkey is an in-memory data store with some optional persistence options. If you plan to compare it to transactional servers (MySQL, PostgreSQL, etc ...), then you should consider activating AOF and decide on a suitable fsync policy.
- Valkey primarily operates as a single-threaded server from the POV of commands execution. While the server can employ threads for I/O operations and command parsing, the core command execution remains sequential. For CPU-intensive workloads requiring multiple cores, users should consider running multiple Valkey instances in parallel. It is not really fair to compare one single Valkey instance to a multi-threaded data store.
The valkey-benchmark program is a quick and useful way to get some figures and
evaluate the performance of a Valkey instance on a given hardware. However,
by default, it does not represent the maximum throughput a Valkey instance can
sustain. Actually, by using pipelining and a fast client (libvalkey), it is fairly
easy to write a program generating more throughput than valkey-benchmark. The
default behavior of valkey-benchmark is to achieve throughput by exploiting
concurrency only (i.e. it creates several connections to the server).
It does not use pipelining or any parallelism at all (one pending query per
connection at most, and no multi-threading), if not explicitly enabled via
the -P parameter. So in some way using valkey-benchmark and, triggering, for
example, a BGSAVE operation in the background at the same time, will provide
the user with numbers more near to the worst case than to the best case.
To run a benchmark using pipelining mode (and achieve higher throughput), you need to explicitly use the -P option. Please note that it is still a realistic behavior since a lot of Valkey based applications actively use pipelining to improve performance. However you should use a pipeline size that is more or less the average pipeline length you'll be able to use in your application in order to get realistic numbers.
The benchmark should apply the same operations, and work in the same way with the multiple data stores you want to compare. It is absolutely pointless to compare the result of valkey-benchmark to the result of another benchmark program and extrapolate.
For instance, Valkey and memcached in single-threaded mode can be compared on GET/SET operations. Both are in-memory data stores, working mostly in the same way at the protocol level. Provided their respective benchmark application is aggregating queries in the same way (pipelining) and use a similar number of connections, the comparison is actually meaningful.
When you're benchmarking a high-performance, in-memory database like Valkey, it may be difficult to saturate the server. Sometimes, the performance bottleneck is on the client side, and not the server-side. In that case, the client (i.e., the benchmarking program itself) must be fixed, or perhaps scaled out, to reach the maximum throughput.
Factors impacting Valkey performance
There are multiple factors having direct consequences on Valkey performance. We mention them here, since they can alter the result of any benchmarks. Please note however, that a typical Valkey instance running on a low end, untuned box usually provides good enough performance for most applications.
-
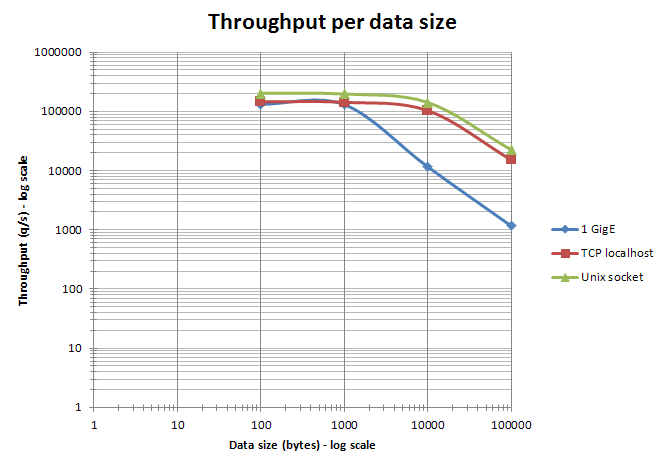
Network bandwidth and latency usually have a direct impact on the performance. It is a good practice to use the ping program to quickly check the latency between the client and server hosts is normal before launching the benchmark. Regarding the bandwidth, it is generally useful to estimate the throughput in Gbit/s and compare it to the theoretical bandwidth of the network. For instance a benchmark setting 4 KB strings in Valkey at 100000 q/s, would actually consume 3.2 Gbit/s of bandwidth and probably fit within a 10 Gbit/s link, but not a 1 Gbit/s one. In many real world scenarios, Valkey throughput is limited by the network well before being limited by the CPU. To consolidate several high-throughput Valkey instances on a single server, it worth considering putting a 10 Gbit/s NIC or multiple 1 Gbit/s NICs with TCP/IP bonding.
-
CPU is another important factor.
-
Speed of RAM and memory bandwidth seem less critical for global performance especially for small objects. For large objects (>10 KB), it may become noticeable though. Usually, it is not really cost-effective to buy expensive fast memory modules to optimize Valkey.
-
Valkey runs slower on a VM compared to running without virtualization using the same hardware. If you have the chance to run Valkey on a physical machine this is preferred. However this does not mean that Valkey is slow in virtualized environments, the delivered performances are still very good and most of the serious performance issues you may incur in virtualized environments are due to over-provisioning, non-local disks with high latency, or old hypervisor software that have slow
forksyscall implementation. -
When the server and client benchmark programs run on the same box, both the TCP/IP loopback and unix domain sockets can be used. Depending on the platform, unix domain sockets can achieve around 50% more throughput than the TCP/IP loopback (on Linux for instance). The default behavior of valkey-benchmark is to use the TCP/IP loopback.
-
The performance benefit of unix domain sockets compared to TCP/IP loopback tends to decrease when pipelining is heavily used (i.e. long pipelines).
-
When an ethernet network is used to access Valkey, aggregating commands using pipelining is especially efficient when the size of the data is kept under the ethernet packet size (about 1500 bytes). Actually, processing 10 bytes, 100 bytes, or 1000 bytes queries almost result in the same throughput. See the graph below.
-
On multi CPU sockets servers, Valkey performance becomes dependent on the NUMA configuration and process location. The most visible effect is that valkey-benchmark results seem non-deterministic because client and server processes are distributed randomly on the cores. To get deterministic results, it is required to use process placement tools (on Linux: taskset or numactl). The most efficient combination is always to put the client and server on two different cores of the same CPU to benefit from the L3 cache. Here are some results of 4 KB SET benchmark for 3 server CPUs (AMD Istanbul, Intel Nehalem EX, and Intel Westmere) with different relative placements. Please note this benchmark is not meant to compare CPU models between themselves (CPUs exact model and frequency are therefore not disclosed).
-
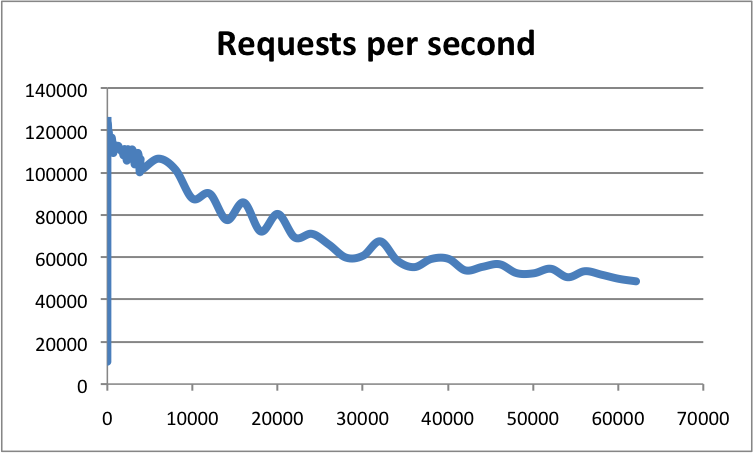
With high-end configurations, the number of client connections is also an important factor. Being based on epoll/kqueue, the Valkey event loop is quite scalable. Valkey has already been benchmarked at more than 60000 connections, and was still able to sustain 50000 q/s in these conditions. As a rule of thumb, an instance with 30000 connections can only process half the throughput achievable with 100 connections. Here is an example showing the throughput of a Valkey instance per number of connections:
-
With high-end configurations, it is possible to achieve higher throughput by tuning the NIC(s) configuration and associated interruptions. Best throughput is achieved by setting an affinity between Rx/Tx NIC queues and CPU cores, and activating RPS (Receive Packet Steering) support. More information in this thread. Jumbo frames may also provide a performance boost when large objects are used.
-
Depending on the platform, Valkey can be compiled against different memory allocators (libc malloc, jemalloc, tcmalloc), which may have different behaviors in term of raw speed, internal and external fragmentation. If you did not compile Valkey yourself, you can use the INFO command to check the
mem_allocatorfield. Please note most benchmarks do not run long enough to generate significant external fragmentation (contrary to production Valkey instances).
Other things to consider
One important goal of any benchmark is to get reproducible results, so they can be compared to the results of other tests.
- A good practice is to try to run tests on isolated hardware as much as possible. If it is not possible, then the system must be monitored to check the benchmark is not impacted by some external activity.
- Some configurations (desktops and laptops for sure, some servers as well) have a variable CPU core frequency mechanism. The policy controlling this mechanism can be set at the OS level. Some CPU models are more aggressive than others at adapting the frequency of the CPU cores to the workload. To get reproducible results, it is better to set the highest possible fixed frequency for all the CPU cores involved in the benchmark.
- An important point is to size the system accordingly to the benchmark.
The system must have enough RAM and must not swap. On Linux, do not forget
to set the
overcommit_memoryparameter correctly. Please note 32 and 64 bit Valkey instances do not have the same memory footprint. - If you plan to use RDB or AOF for your benchmark, please check there is no other I/O activity in the system. Avoid putting RDB or AOF files on NAS or NFS shares, or on any other devices impacting your network bandwidth and/or latency (for instance, EBS on Amazon EC2).
- Set Valkey logging level (loglevel parameter) to warning or notice. Avoid putting the generated log file on a remote filesystem.
- Avoid using monitoring tools which can alter the result of the benchmark. For instance using INFO at regular interval to gather statistics is probably fine, but MONITOR will impact the measured performance significantly.
- When running
valkey-benchmarkon the same machine as thevalkey-serverbeing tested, you may need to run the benchmark with at least two threads (--threads 2) to prevent the benchmarking tool itself from being the bottleneck, i.e. prevent thatvalkey-benchmarkis running on 100% CPU whilevalkey-serveris using less than 100% CPU.
Other Valkey benchmarking tools
There are several third-party tools that can be used for benchmarking Valkey. Refer to each tool's documentation for more information about its goals and capabilities.
- memtier_benchmark from Redis Ltd. is a NoSQL Valkey, Redis and Memcache traffic generation and benchmarking tool.
- rpc-perf from Twitter is a tool for benchmarking RPC services that supports Valkey and Memcache.
- YCSB from Yahoo @Yahoo is a benchmarking framework with clients to many databases, including Valkey.
